> For the complete documentation index, see [llms.txt](https://dbi-services.gitbook.io/omrun-help/llms.txt). Markdown versions of documentation pages are available by appending `.md` to page URLs; this page is available as [Markdown](https://dbi-services.gitbook.io/omrun-help/menu-functions/button-dashboard.md).
# Button Dashboard
### 
### Open in your Browser
The "Dashboard" function displays the test results from the web platform (IIS) in your browser. It leads directly to the releated opened business system in OMrun.
OMrun Dashboard Environment Level
### Dashboard Error
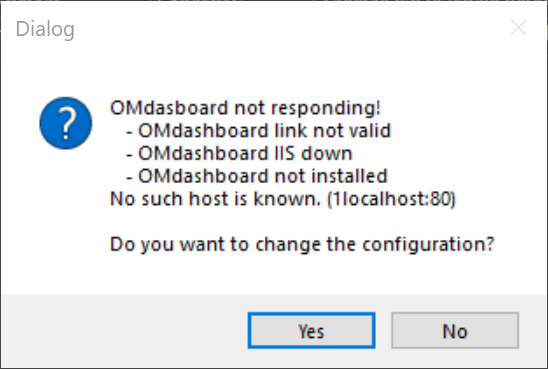
If a connection to the configured dashboard is not possible currently the error message below will be displayed:
OMrun Dashboard Connection Error
With the button `Yes` you will transferred to the [Dashboard Configuration](/omrun-help/configuration/dashboard-configuration.md) window where you can modify the link to the IIS installation.